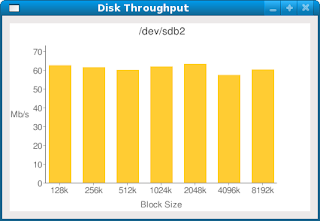
I though this script would be useful but did not want to have to cut and paste a URL into a Web browser so I decided to eliminate that step.
This Python script is loosely based on their script but uses the Python urllib libraries to connect to Google Charts to generate a PNG image file which is subsequently displayed using pyGTK+ routines.
#!/usr/bin/env python

import sys
import os
import commands
import re
from optparse import OptionParser
import urllib
import urllib2
import pygtk
pygtk.require('2.0')
import gtk

class DisplayGraph:

def delete_event(self, widget, event, data=None):
   return False

def destroy(self, widget, data=None):
   gtk.main_quit()

def __init__(self):
   self.window = gtk.Window(gtk.WINDOW_TOPLEVEL)
   self.window.connect("delete_event", self.delete_event)
   self.window.connect("destroy", self.destroy)
   self.window.set_border_width(10)
   self.window.set_position(gtk.WIN_POS_CENTER)
   self.window.set_title("Disk Throughput")

   pixbuf = gtk.gdk.pixbuf_new_from_file("/tmp/dd.png")
   os.remove("/tmp/dd.png")

   self.image = gtk.Image()
   self.image.set_from_pixbuf(pixbuf)
   self.image.show()
   self.window.add(self.image)
   self.window.show()

def main(self):
   gtk.main()

class GoogleChart:

def __init__(self):
   self.gchart_url = "http://chart.apis.google.com/chart?"
   self.gchart_type = "cht=bvs"
   self.gchart_title = "&chtt="
   self.gchart_data = "&chd=t:"
   self.gchart_labels = "&chxl=0:|"
   self.gchart_size = "&chs=400x250"
   self.gchart_axis_labels = "&chxt=x,y,x,y"
   self.gchart_axis_position = "&chxp=2,50|3,50"
   self.gchart_bar_settings = "&chbh=30,15"

def title(self,title):
   self.gchart_title = self.gchart_title + title

def write(self, data, labels, max_t):
    self.gchart_data = self.gchart_data + data.rstrip(',')
    self.gchart_labels = self.gchart_labels  \
      + labels + "2:|Block%20Size|3:|Mb/s"
    self.gchart_axis_range = "&chxr=1,0," + str(max_t+10.0)
    self.gchart_scaling = "&chds=0," + str(max_t+10.0)
    self.gchart_url += self.gchart_type \
      + self.gchart_title + self.gchart_size
    self.gchart_url += self.gchart_bar_settings \
      + self.gchart_data + self.gchart_labels
    self.gchart_url += self.gchart_axis_labels  \
      + self.gchart_axis_position
    self.gchart_url += self.gchart_axis_range \
      + self.gchart_scaling

   opener = urllib2.urlopen(self.gchart_url)
   if opener.headers['content-type'] != 'image/png':
      raise BadContentTypeException('Server responded' \
         'with a content-type of %s' \
         % opener.headers['content-type'])
   open("/tmp/dd.png", 'wb').write(opener.read())

def get_disk_throughput(device, blocksize):
   blocksize = str(blocksize) + 'k'
   cmd = "dd if=/dev/zero of=%s bs=%s" % (device,blocksize)
   output = commands.getoutput(cmd)

   throughput = 0
   unit = ""
   for line in output.split('n'):
      s = re.search(' copied,.*, (\S+) (\S+)$', line)
      if s:
         throughput = s.group(1)
         unit = s.group(2)
         break
   return (throughput, unit)

if __name__ == "__main__":
   usage = "Usage: %prog options"
   parser = OptionParser(usage=usage)
   parser.add_option("-d", "--device", dest="device", \
      help="Device to use. Disk data will be overwritten!")
   (options, args) = parser.parse_args()
   device = options.device
   if not device:
      parser.print_help()
      sys.exit(1)

max_t = 0.0
# block sizes to test dd write
blocksizes = [128, 256, 512, 1024, 2048, 4096, 8192]
data=""
labels=""
for blocksize in blocksizes:
    (t, u) = get_disk_throughput(device, blocksize)
    if float(t) > max_t:
        max_t = float(t)
    data += str(t) + ","
    labels += str(blocksize) + "k" + "|"

chart = GoogleChart()
chart.title(device)
chart.write(data, labels, max_t)

graph = DisplayGraph()
graph.main()

BTW, this script was developed and tested on Fedora 9. Enjoy!
0 comments:
Post a Comment